TYC_7788M374M1 (nirps_he_online_udem)
This page was last modified: 2026-03-09 10:21:01.427658 (UTC)
Back to the object table
Contents
Target info
This section gives some details of the APERO astrometric database used when processing this target (e.g. for BERV calculation). Any observation with a object name in the alias list will be associated with this “APERO target” i.e. DRSOBJN=TYC_7788M374M1
Target Information |
|
|---|---|
RA |
203.9874359 [deg] (Gaia DR3) |
Dec |
-39.10614416 [deg] (Gaia DR3) |
Finder chart |
|
Teff |
4944.0 [K] (2020AJ….160…83S) |
Spectral Type |
None (None) |
Proper Motion (RA) |
25.2346719 [mas/yr] (Gaia DR3) |
Proper Motion (Dec) |
76.69334578 [mas/yr] (Gaia DR3) |
Parallax |
11.06316222 [mas/yr] (Gaia DR3) |
Radial Velocity |
53.87 [mas/yr] (2020AJ….160…83S) |
Aliases |
TYC 7788-374-1, GSC 07788-00374, 2MASS J13355695-3906233, RAVE J133557.0-390623, TIC 165725822, Gaia DR2 6161606404066308992, Gaia DR3 6161606404066308992, Gaia DR1 6161606296689714816, J1335-39, TYC7788-374-1, GSC07788-00374, 2MASSJ13355695-3906233, RAVEJ133557.0-390623, TIC165725822, GaiaDR26161606404066308992, GaiaDR36161606404066308992, GaiaDR16161606296689714816, J1335-39 |
OBJECT name(s) in headers |
J1335-39 |
OB Name(s) in headers |
J1335-39 |
PI name(s) in headers |
UNKNOWN |
Project/Run name(s) in headers |
115.27UZ.001 |
Spectrum
This section presents the observation after extraction,with and without telluric correction.
LBL
No LBL reduction found
CCF
No CCF files found
Time series
This section deals with providing the time series information for this object
Obs Dir |
First obs mid |
Last obs mid |
Number of ext |
Number of tcorr |
Seeing |
Airmass |
Mean Exptime |
Total Exptime |
SNR[Order 15 (#134 1.08um)] |
SNR[Order 60 (#89 1.63um)] |
DPRTYPEs |
ext_files |
tcorr_files |
Request ext files |
Request tcorr files |
|---|---|---|---|---|---|---|---|---|---|---|---|---|---|---|---|
2025-04-28 |
2025-04-29 02:40:08.277 |
2025-04-29 02:40:08.277 |
1 |
0 |
-1.000 |
1.052 |
300.958 |
300.958 |
35.333 |
47.553 |
OBJ_FP |
||||
2025-05-18 |
2025-05-19 06:20:16.101 |
2025-05-19 06:20:16.101 |
1 |
0 |
0.770 |
1.463 |
300.958 |
300.958 |
30.588 |
43.021 |
OBJ_FP |
||||
2025-05-20 |
2025-05-21 05:48:26.225 |
2025-05-21 05:48:26.225 |
1 |
0 |
0.770 |
1.350 |
300.958 |
300.958 |
35.436 |
48.316 |
OBJ_FP |
||||
2025-06-16 |
2025-06-17 02:35:34.395 |
2025-06-17 02:35:34.395 |
1 |
0 |
3.250 |
1.108 |
300.958 |
300.958 |
19.836 |
30.528 |
OBJ_FP |
||||
2025-06-18 |
2025-06-19 03:38:08.896 |
2025-06-19 03:38:08.896 |
1 |
0 |
1.830 |
1.288 |
300.958 |
300.958 |
17.945 |
25.844 |
OBJ_FP |
||||
2025-06-19 |
2025-06-20 02:39:11.535 |
2025-06-20 02:39:11.535 |
1 |
0 |
1.210 |
1.138 |
300.958 |
300.958 |
18.776 |
29.514 |
OBJ_FP |
Debug
This section has various debug plots from APERO products
Telluric map

Telluric map of e2dsff_tcorr_A files.Files are low-passed and corrected for the stars motion. The QC is displayed to the right of the image - in purple are the files that passed, in orange the files that failed.
Maximum Saturation level plot
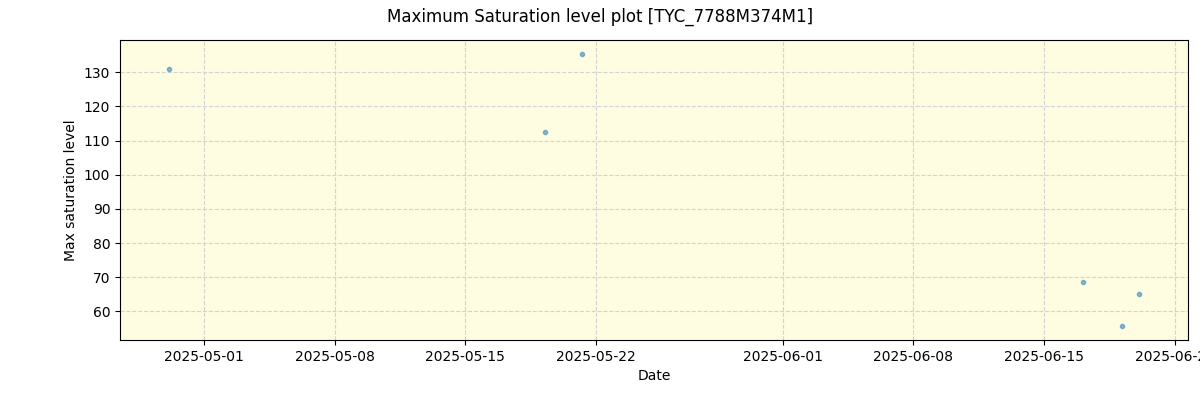
Maximum saturation level measured at time of extraction
Measured effective readout noise before extraction
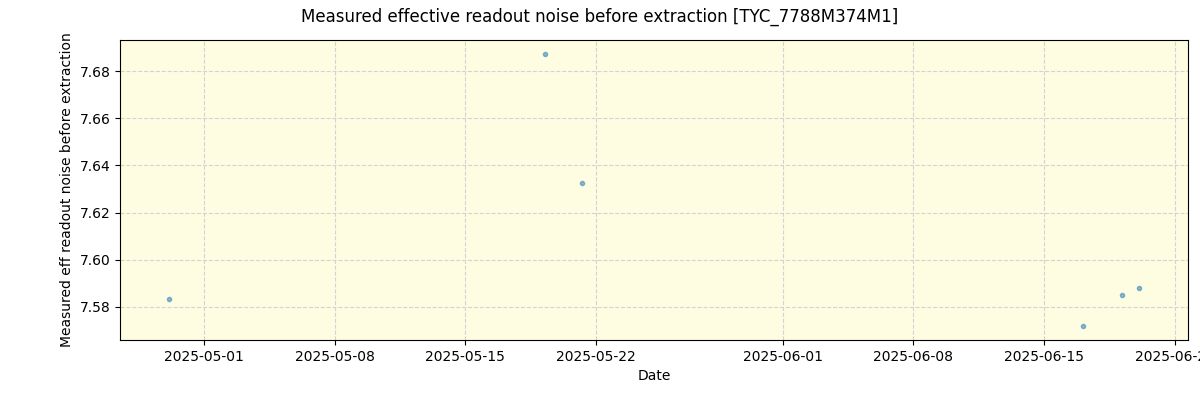
Measured effective readout noise before extraction
APERO Processing Debug Plot
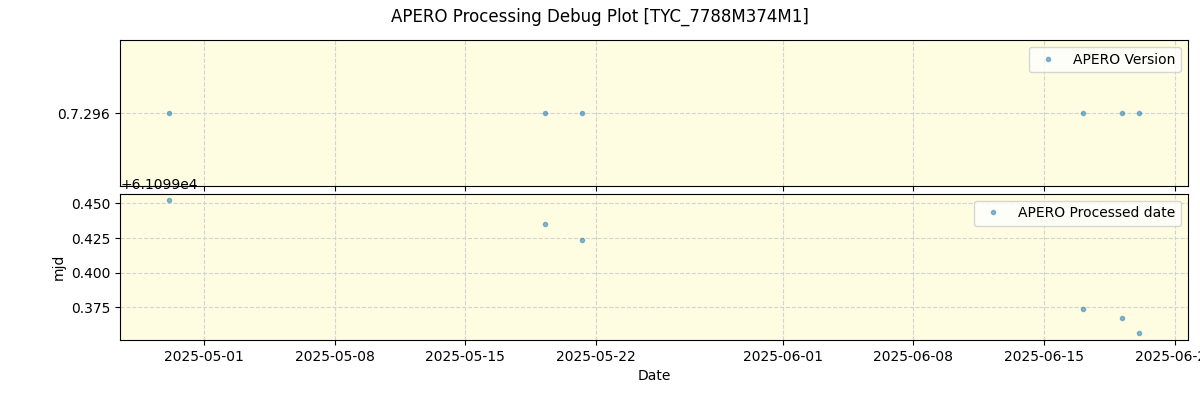
Plotting the version and processed date from the header from APERO. Note that offline reductions should lead to a straight line, while online reductions should be roughly a one-to-one with the Date axis.
APERO Calibration times plot
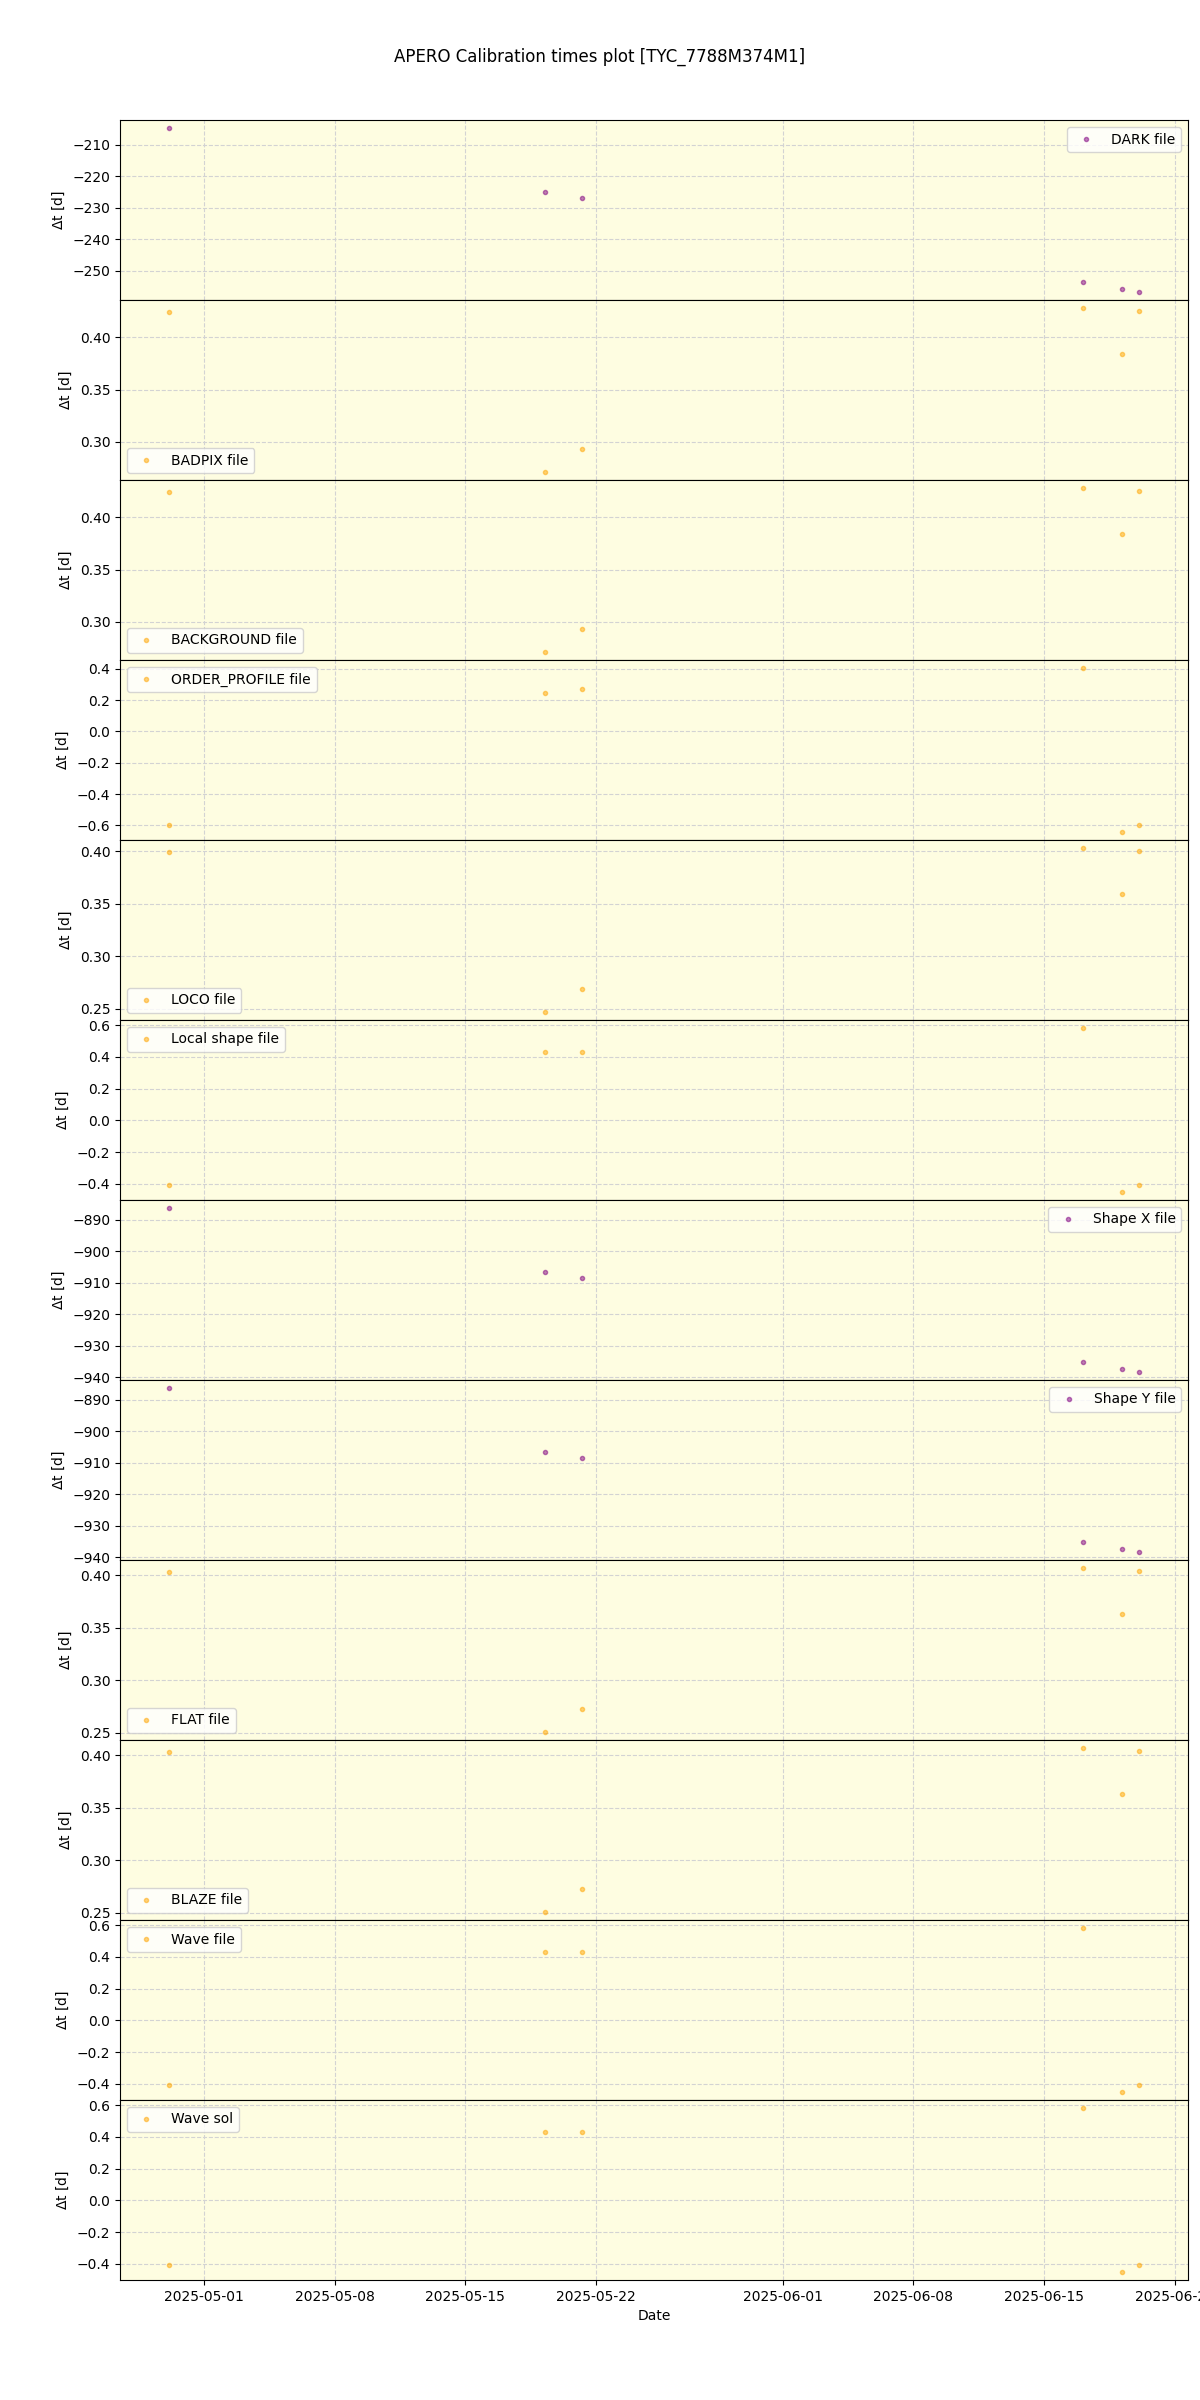
Computed time between observation and calibration used. Some calibrations arereference calibrations (in purple) and thus diverge from the reference night, others should always be from the same night (orange) unless no calibration was taken that night in which case the closest calirbation in time should have been used.