HD111980 (nirps_he_online_udem)
This page was last modified: 2026-03-09 10:07:32.965798 (UTC)
Back to the object table
Contents
Target info
This section gives some details of the APERO astrometric database used when processing this target (e.g. for BERV calculation). Any observation with a object name in the alias list will be associated with this “APERO target” i.e. DRSOBJN=HD111980
Target Information |
|
|---|---|
RA |
193.31408 [deg] (Gaia DR2) |
Dec |
-18.52565246 [deg] (Gaia DR2) |
Finder chart |
|
Teff |
5878.0 [K] (2024A&A…682A.116N) |
Spectral Type |
F7V (1988MSS…C04….0H) |
Proper Motion (RA) |
299.4890308 [mas/yr] (Gaia DR2) |
Proper Motion (Dec) |
-796.0918272 [mas/yr] (Gaia DR2) |
Parallax |
12.92544804 [mas/yr] (Gaia DR2) |
Radial Velocity |
155.0 [mas/yr] (2004A&A…424..727P) |
Aliases |
HD 111980, ** RST 2821, BD-17 3723, CCDM J12533-1831AB, Ci 20 747, GC 17484, GCRV 7708, GEN# +1.00111980, HIC 62882, HIP 62882, IDS 12479-1758 AB, LFT 954, LHS 2647, LPM 452, LTT 4924, 2MASS J12531501-1831185, NBP 172, NLTT 32187, PLX 2957, PLX 2957.00, PM 12506-1814, PPM 226486, RAVE J125315.0-183120, RAVE J125315.1-183120, SAO 157573, SBC9 2560, TIC 5914520, TYC 6114-1018-1, UBV 11600, UBV M 18773, uvby98 100111980, WDS J12533-1831AB, WEB 11146, WISEA J125315.26-183128.0, YZ 108 4921, Gaia DR2 3510294882898890880, Gaia DR3 3510294882898890880, J1253-18, HD111980, **RST2821, BD-173723, CCDMJ12533-1831AB, Ci20747, GC17484, GCRV7708, GEN#+1.00111980, HIC62882, HIP62882, IDS12479-1758AB, LFT954, LHS2647, LPM452, LTT4924, 2MASSJ12531501-1831185, NBP172, NLTT32187, PLX2957, PLX2957.00, PM12506-1814, PPM226486, RAVEJ125315.0-183120, RAVEJ125315.1-183120, SAO157573, SBC92560, TIC5914520, TYC6114-1018-1, UBV11600, UBVM18773, uvby98100111980, WDSJ12533-1831AB, WEB11146, WISEAJ125315.26-183128.0, YZ1084921, GaiaDR23510294882898890880, GaiaDR33510294882898890880, J1253-18 |
OBJECT name(s) in headers |
J1253-18 |
OB Name(s) in headers |
J1253-18 |
PI name(s) in headers |
UNKNOWN |
Project/Run name(s) in headers |
115.27UZ.001 |
Spectrum
This section presents the observation after extraction,with and without telluric correction.
LBL
No LBL reduction found
CCF
No CCF files found
Time series
This section deals with providing the time series information for this object
Obs Dir |
First obs mid |
Last obs mid |
Number of ext |
Number of tcorr |
Seeing |
Airmass |
Mean Exptime |
Total Exptime |
SNR[Order 15 (#134 1.08um)] |
SNR[Order 60 (#89 1.63um)] |
DPRTYPEs |
ext_files |
tcorr_files |
Request ext files |
Request tcorr files |
|---|---|---|---|---|---|---|---|---|---|---|---|---|---|---|---|
2025-04-26 |
2025-04-27 01:00:39.831 |
2025-04-27 01:00:39.831 |
1 |
0 |
-1.000 |
1.196 |
300.958 |
300.958 |
105.758 |
127.968 |
OBJ_FP |
||||
2025-05-18 |
2025-05-19 05:26:28.973 |
2025-05-19 05:37:09.940 |
2 |
0 |
1.050 |
1.584 |
300.958 |
601.916 |
71.878 |
91.274 |
OBJ_FP |
||||
2025-05-20 |
2025-05-21 04:23:37.603 |
2025-05-21 04:23:37.603 |
1 |
0 |
0.690 |
1.263 |
300.958 |
300.958 |
102.333 |
122.473 |
OBJ_FP |
||||
2025-06-16 |
2025-06-17 01:58:13.816 |
2025-06-17 01:58:13.816 |
1 |
0 |
3.250 |
1.146 |
300.958 |
300.958 |
79.585 |
100.751 |
OBJ_FP |
||||
2025-06-19 |
2025-06-20 01:43:33.002 |
2025-06-20 01:43:33.002 |
1 |
0 |
0.860 |
1.139 |
300.958 |
300.958 |
83.164 |
109.410 |
OBJ_FP |
||||
2025-06-20 |
2025-06-21 02:32:58.791 |
2025-06-21 02:32:58.791 |
1 |
0 |
1.230 |
1.308 |
300.958 |
300.958 |
96.971 |
121.841 |
OBJ_FP |
||||
2025-06-23 |
2025-06-24 02:02:02.049 |
2025-06-24 02:02:02.049 |
1 |
0 |
1.090 |
1.235 |
300.958 |
300.958 |
97.697 |
124.132 |
OBJ_FP |
||||
2025-06-26 |
2025-06-27 01:44:15.122 |
2025-06-27 01:44:15.122 |
1 |
0 |
1.280 |
1.216 |
300.958 |
300.958 |
86.421 |
112.861 |
OBJ_FP |
||||
2025-07-01 |
2025-07-01 23:08:08.416 |
2025-07-01 23:08:08.416 |
1 |
0 |
1.470 |
1.018 |
300.958 |
300.958 |
91.440 |
115.926 |
OBJ_FP |
Debug
This section has various debug plots from APERO products
Telluric map

Telluric map of e2dsff_tcorr_A files.Files are low-passed and corrected for the stars motion. The QC is displayed to the right of the image - in purple are the files that passed, in orange the files that failed.
Maximum Saturation level plot
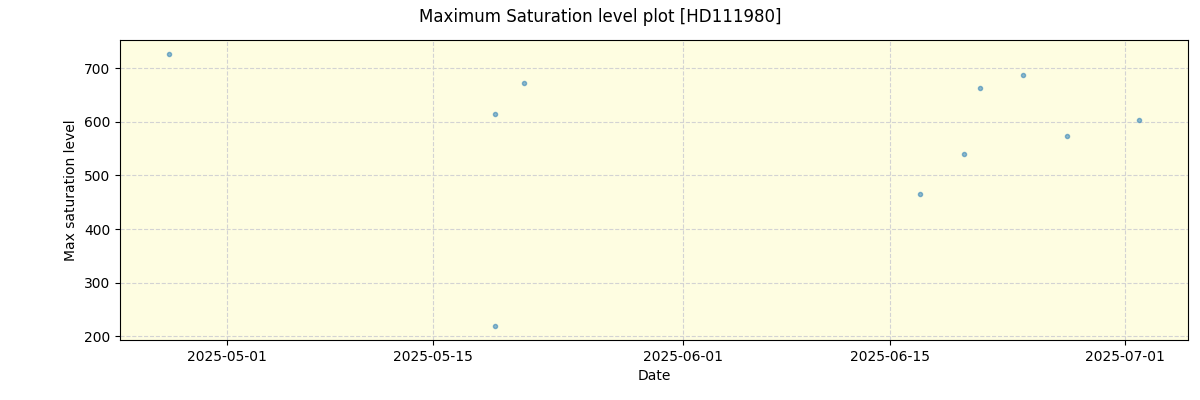
Maximum saturation level measured at time of extraction
Measured effective readout noise before extraction
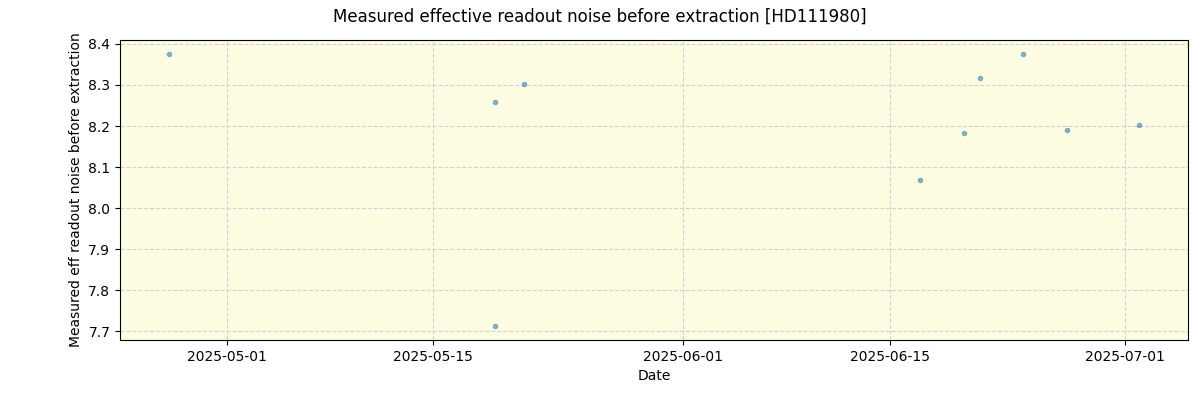
Measured effective readout noise before extraction
APERO Processing Debug Plot
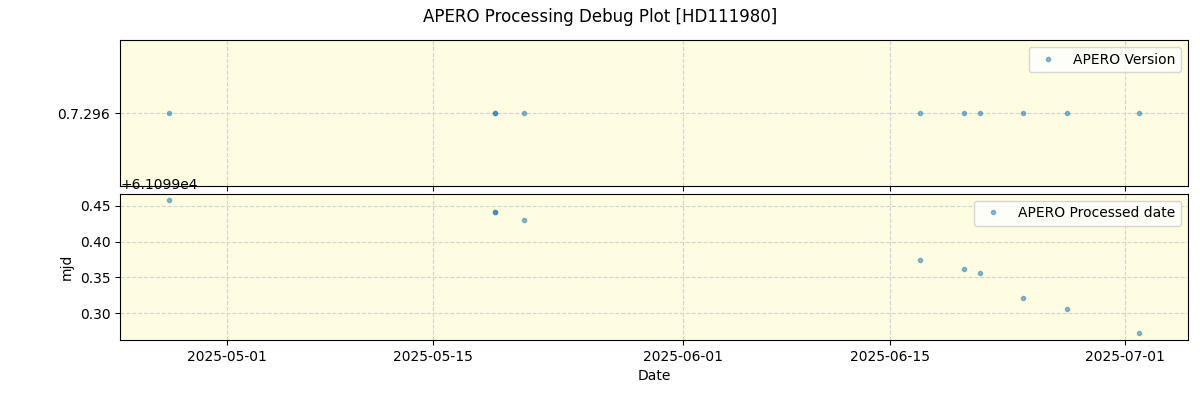
Plotting the version and processed date from the header from APERO. Note that offline reductions should lead to a straight line, while online reductions should be roughly a one-to-one with the Date axis.
APERO Calibration times plot
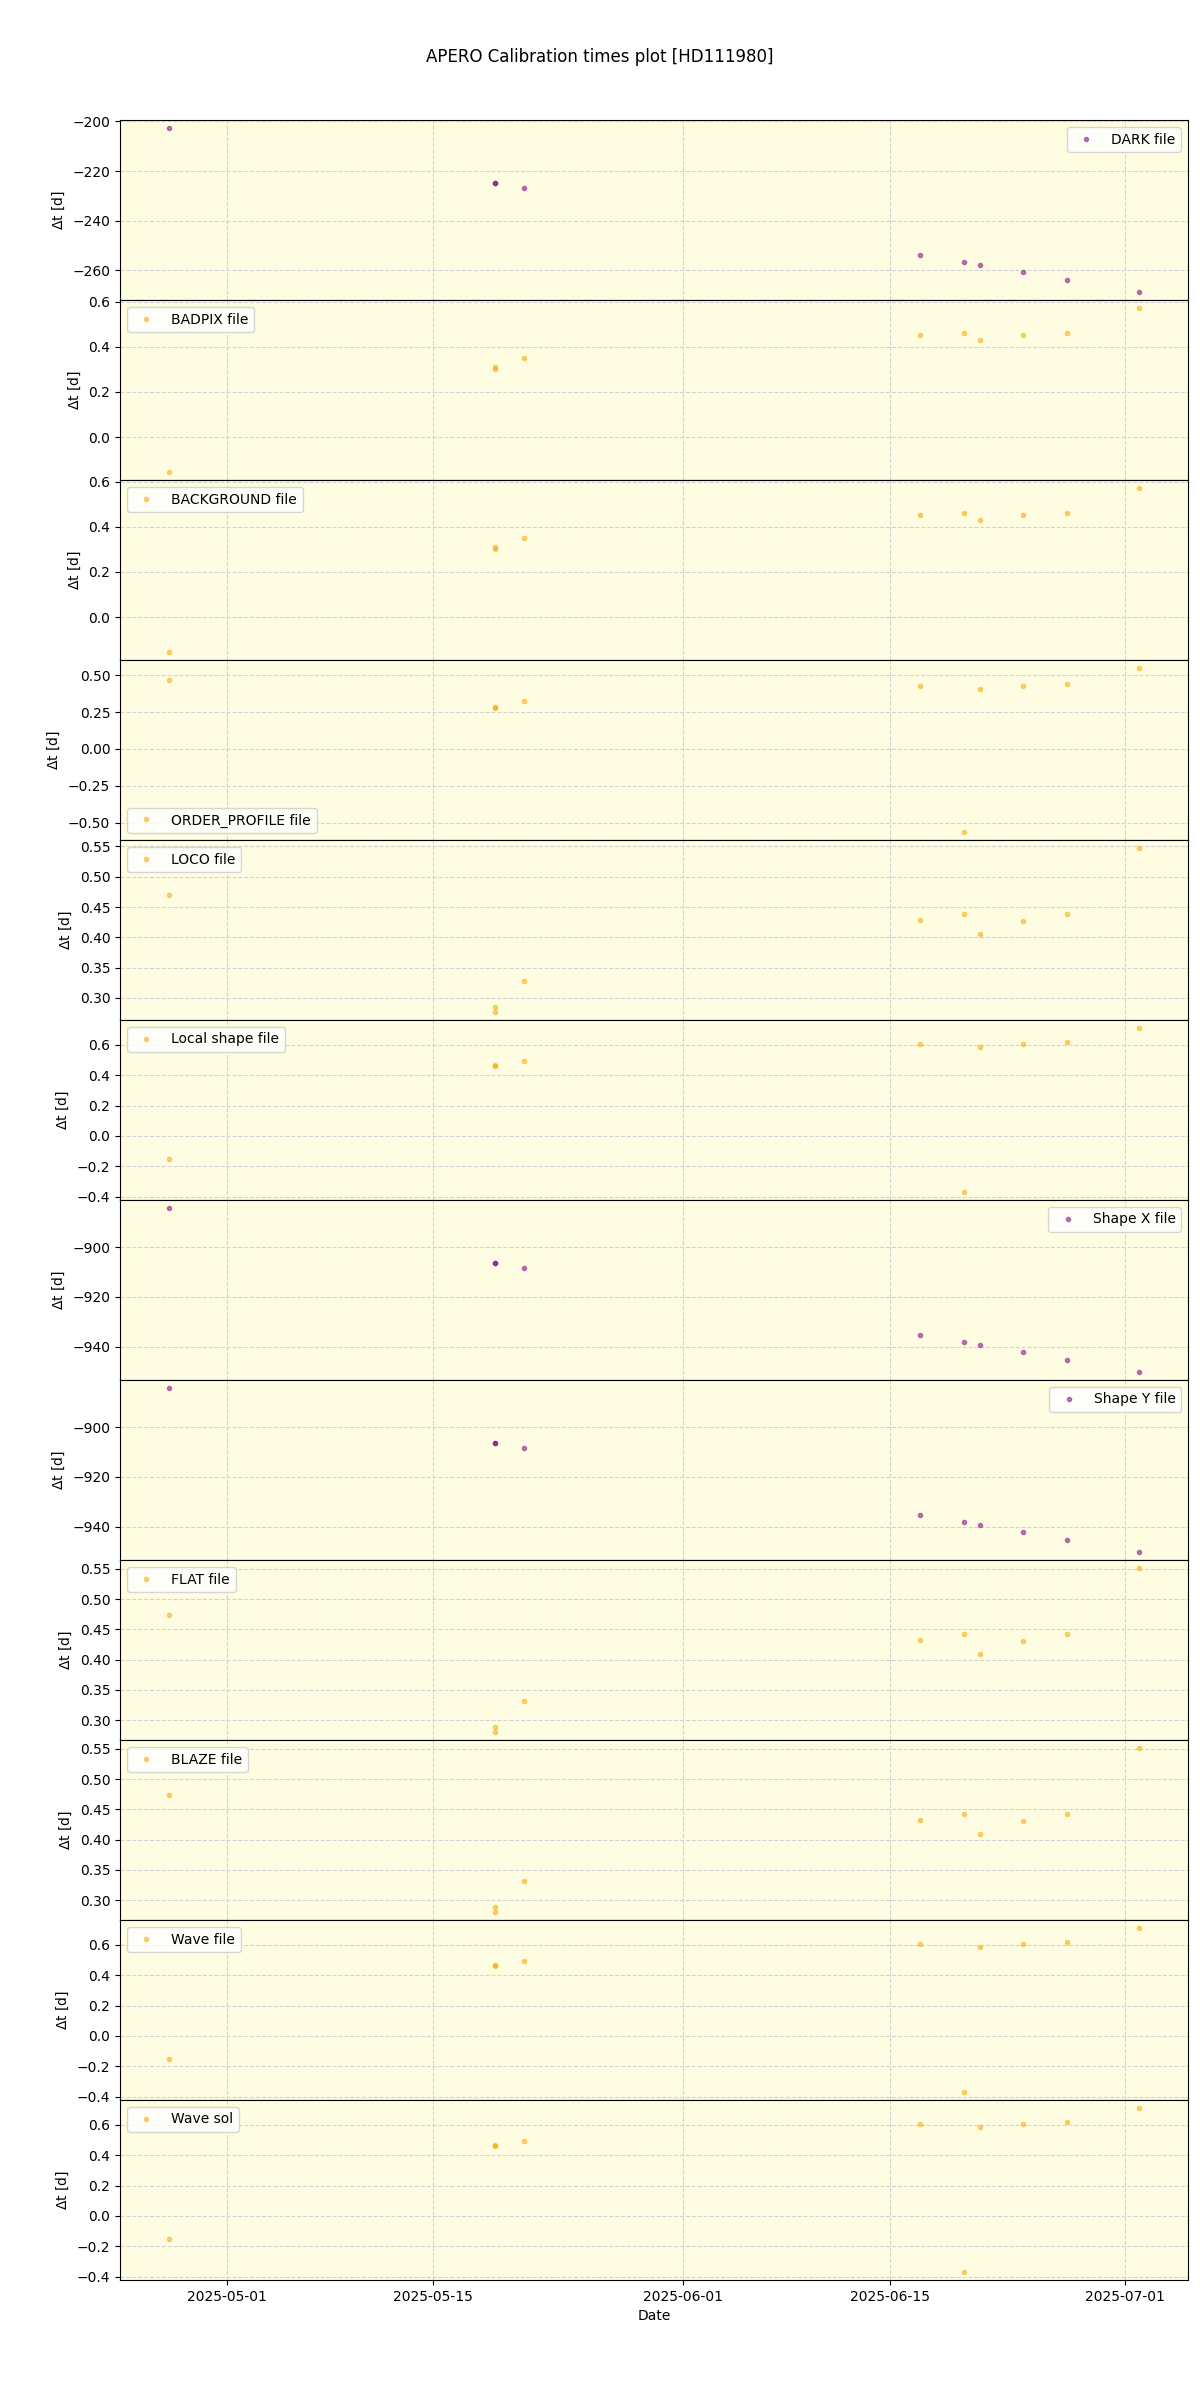
Computed time between observation and calibration used. Some calibrations arereference calibrations (in purple) and thus diverge from the reference night, others should always be from the same night (orange) unless no calibration was taken that night in which case the closest calirbation in time should have been used.